debugging breakpoints
This is the second part of the Break points tutorial. Before you continue reading this article, you might want to check out part 1, if you haven’t already done that. With that being said we can return our focus on this article.
The main goal in this article is to explain the debugging breakpoints window in Visual Studio. If this window is not turned on in your Visual Studio, you can do that from the following menu:
Debug menu -> Windows -> Breakpoints OR by using the shortcut Ctrl + D, B. I especially love this windows because it offers a lot of debugging power. Without hesitation you can say that it is an essential debugging tool, and you will not be wrong about it. The window can be seen in the image below.
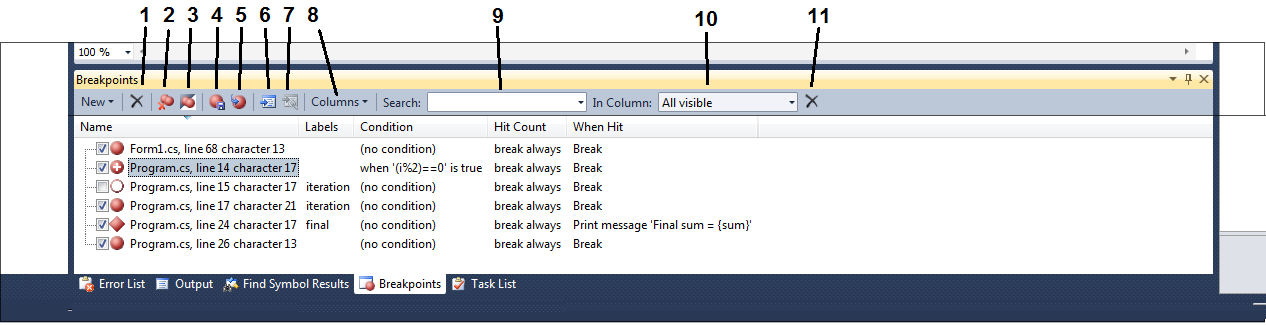
On first look this window has all the breakpoints listed inside with a little more detail like the Name of the break point, Labels associated with the break point, Condition if any, hit count setting etc, etc. Of course you can add/remove columns in/from this window to meed your needs. The name itself is formed from the file where the break point is, the line and character. Unfortunately there is no mechanism to change the name of a break point.
Double clicking on the item (break point) will take you to the code line where that break point is placed. This is very helpful for long code spread around multiple files, and thats the real world situation. The code that need to be debugged is almost never in same method and in one file, so navigating trough the break points without this window would be a real pain. Thanks to this window you can also easily enable and disable the break point(s). Often you don’t want to remove certain break point(s), but from time to time you don’t want your code to break there and skip that specific break point. You can do that simply by checking/un-checking the check box in front of the break point inside this window. Yes, it is that easy.
At the top of the window there are some tools available. I will try to explain each tool using the number associated with it, in our image above.
- Deletes the selected breakpoints
- Deletes all breakpoints, matching the current search criteria
- Enables or disables all breaking points, matching the current search criteria
- Exports all breakpoints, matching the current search criteria
- Import breakpoints from a file
- Goes to source code
- Goes to dissasembly
- Hide/show columns in the breakpoints window
- Search mechanism for filtering the breakpoints using search criteria
- Choose the column in which the search criteria will be applied
- Resets all search criteria, causing all breakpoints to be shown
Passing through our two articles related to breakpoints, you should now be able to handle and successfully debug real world examples with less effort and hassle than before. But stay tuned for our third post in this mini series where we will dive even deeper and expose a few more tricks that every developer should know.